U.S. Emissions Breakdown
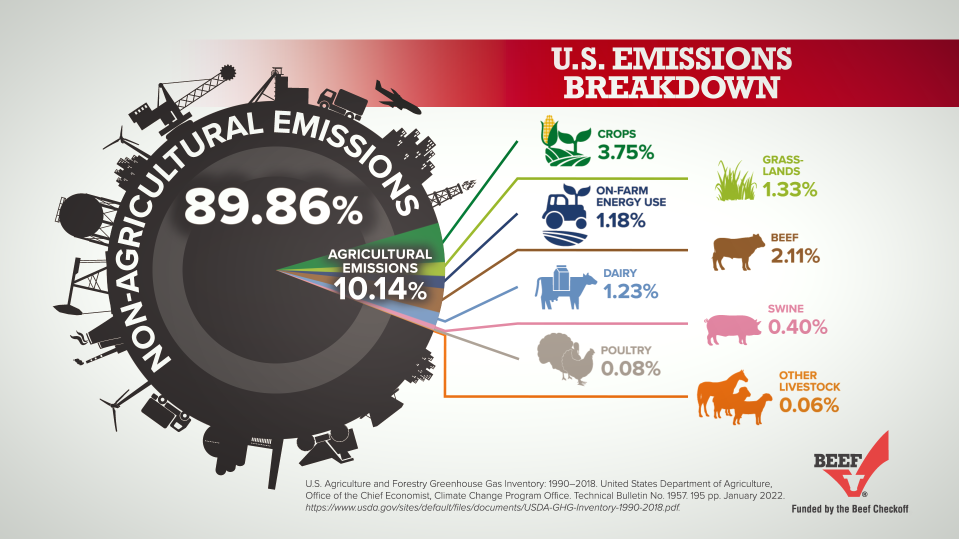
Learn more about from what sources the United States contributes to global emissions, and to what percentage each source is responsible for.
- Examples of emissions from crops include synthetic fertilizers, livestock manure, cultivation, soil volatilization, runoff and residue burning.
- Examples of emissions from grasslands include manure deposited on grasslands, soil volatilization, leaching, and runoff.
- Examples of emissions from on-farm energy use include gasoline, diesel, liquefied petroleum gas, natural gas, and electricity directly related to agricultural production.
- Examples of emissions from livestock (beef, dairy, swine, poultry, other) include enteric methane fermentation from animals and managed manure (storage, dry lot, lagoon).
Calculations
Total US GHG Emissions (pg. 1): 6,676.6 MMT CO2 eq.
Agricultural Emissions (pg.1): 677.2 MMT CO2 eq. (includes CO2 sinks of 2.0 MMT CO2 eq. cropped soils and 13.4 MMT CO2 eq. grazed soils)
Crops (pg.3): 250.6/6676.6 = 0.0375 = 3.75%
Grassland (pg. 3): 89.1/6676.6 = 0.0133 = 1.33%
On-Farm Energy Use (pg.3): 78.7/6676.6 = 0.0118 = 1.18%
Livestock (pg.14; enteric fermentation + managed livestock manure)
Beef: 140.74/6676.6 = 0.0211 = 2.11%
Dairy: 82.02/6676.6 = 0.0123 = 1.23%
Swine: 26.98/6676.6 = 0.0040 = 0.40%
Poultry: 5.18/6676.6 = 0.0008 = 0.08%
Other (pg. 14; horses, sheep, goats, bison, mules and asses): 3.78/6676.6 = 0.0006 = 0.06%
References
- U.S. Agriculture and Forestry Greenhouse Gas Inventory: 1990–2018. United States Department of Agriculture, Office of the Chief Economist, Office of Energy and Environmental Policy. Technical Bulletin No. 1957. 181 pp. January 2022. https://www.usda.gov/sites/default/files/documents/USDA-GHG-Inventory-1990-2018.pdf
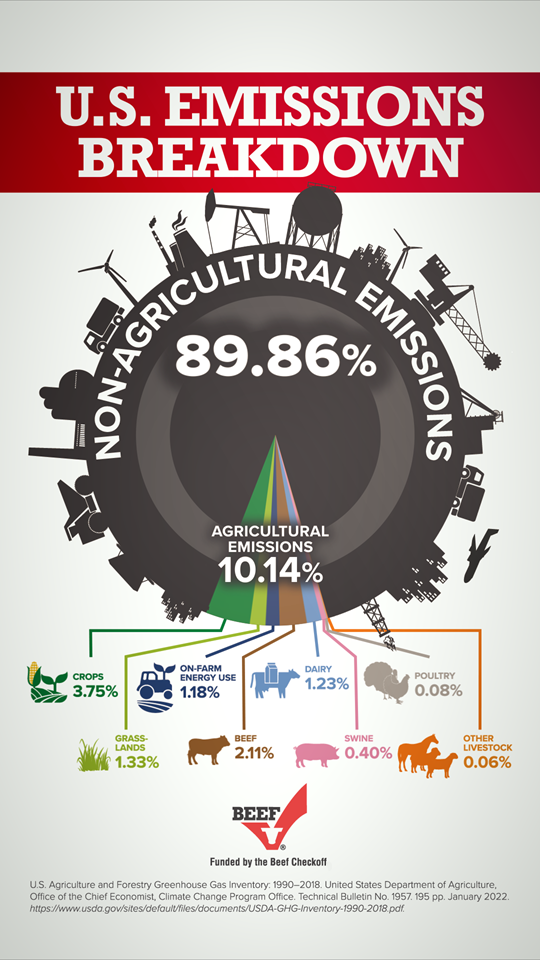
Click an image below to download a still version of the infographic.

