Project Summary
Salmonella in the Peripheral Lymph Nodes of Cattle: Host, Agent and Environmental Factors
- Principle Investigator(s):
- David G. Renter1, T. G. Nagaraja1, Natalia Cernicchiaro1, Tom S. Edrington2, Guy H. Loneragan3, Devin L. Hanson3
- Institution(s):
- 1Department of Diagnostic Medicine and Pathobiology, College of Veterinary Medicine, Kansas State University
- 2USDA-ARS, Food and Feed Safety Research Unit, College Station, TX
- 3Department of Animal and Food Sciences, Texas Tech University
- Completion Date:
- May 2013
Background
Conducting a within feedlot comparison of Holstein and beef breed steers will show if the difference in Salmonella prevalence of the peripheral lymph nodes previously reported to differ among fed vs cull cattle is a function of the dairy breed. Further, the longitudinal data on flies and fecal shedding of feedlot cattle during a summer finishing period will enhance the understanding of the ecological factors that may be contributing to Salmonella in peripheral lymph nodes of fed cattle. Finally, development of a PCR to detect and quantify Salmonella may enable validation of a valuable tool for applied research and surveillance.
The objectives of this study were to:
- Determine the Salmonella prevalence and strain diversity in fecal samples from commercial feedlot pens and assess associations with lymph node Salmonella at harvest (KSU).
- Determine the performance of a PCR procedure to detect and quantify Salmonella in peripheral lymph nodes (KSU).
- Determine the difference in Salmonella prevalence across multiple production agriculture operations in the Texas High Plains (TTU).
- Using paired sampling within feedlots, determine differences in peripheral lymph node and fecal prevalence of Salmonella among Holstein (B&W) and non-Holstein (native or colored) cattle (ARS).
- Determine the Salmonella prevalence and strain diversity in flies from commercial feedlot pens and assess associations with lymph node Salmonella at harvest in conjunction with vaccine experiment (ARS).
For Objective A, twenty-four pens of feedlot cattle (>80 cattle/pen, ~2100 total cattle) from one large commercial feedlot operation were enrolled in an intervention study (data on treatment effects are not presented as they were outside the scope of this project). The study consisted of a randomized completed block design with two treatments and pen as the experimental unit. Cattle were randomly allocated into 24 pens within 12 blocks based on time of allocation, starting in April 2013. Within each block, cattle were allocated concurrently into two pens, one for each treatment group. Twenty freshly voided fecal pats were collected from pen floors once a month, during June and July 2013. The third and final set of fecal samples was collected in August 2013 (25 fecal samples/pen), approximately 12 h before cattle were shipped to a commercial processing plant.
For Objective B, a real time PCR procedure targeting specific regions of the invA gene was developed to detect and quantify Salmonella in bovine lymph nodes and fecal samples. In addition, Salmonella negative lymph nodes and fecal samples were spiked with different strains of Salmonella and serial dilutions were used to determine the detection limit of the assay. A total of 647 sub-iliac lymph nodes from feedlot steers were tested with the PCR test (pre- and post-enrichment) for Salmonella detection and test validation. Data were analyzed to determine the performance (Sensitivity and Specificity) and agreement (Cohen’s Kappa) of these assays for detection and quantification of Salmonella.
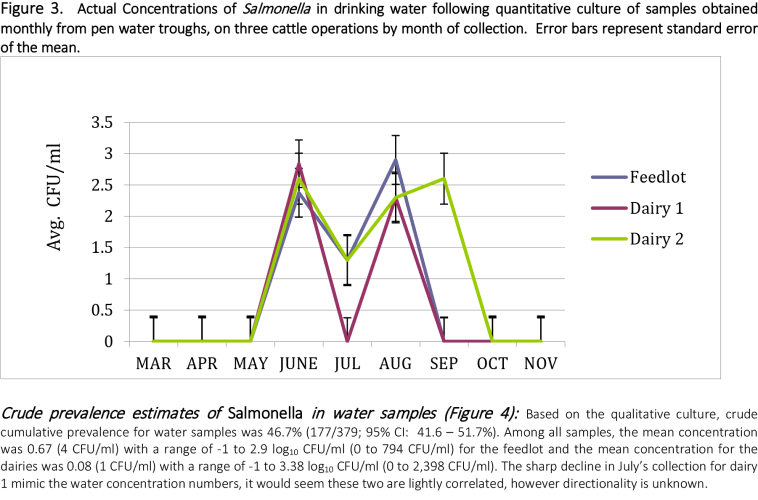
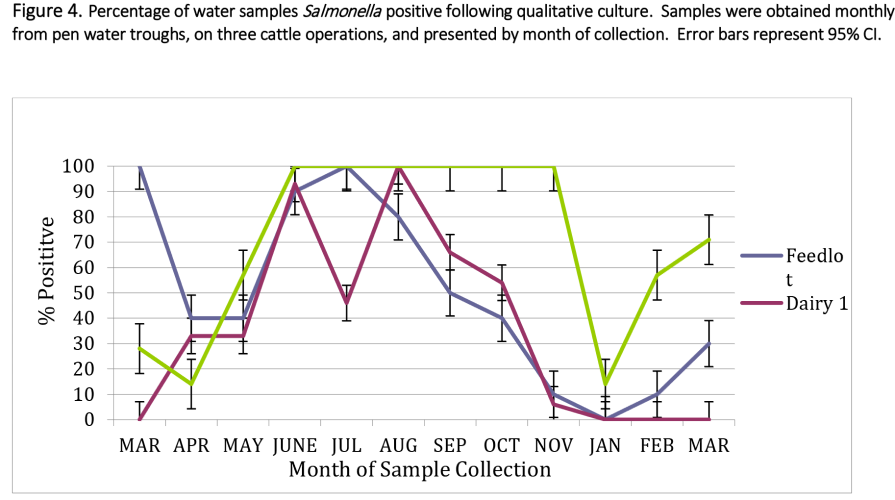
For Objective C, collections were made on 3 regionally co-located operations that included 2 dairies and 1 feedlot. Samples were collected monthly from March 2013 through March 2014, excluding December 2013. Sample collection consisted of 25 fresh fecal pats from each of 5 pens on the 3 facilities, including water samples from each individual pen (each monthly collection included 375 fecal and 32 water samples; except for the first month that only yielded 27 water samples for a total of 4,500 fecal pats and 379 water samples). The number of water samples varied across operations due that some pens had more than 1 water trough. Samples were shipped for Salmonella testing as previously described in objective A.
For Objective D, feedlots in the Southwestern United States were identified that were currently feeding both B&W and native cattle. Using paired sampling within a feedlot, sub-iliac lymph nodes were collected from 75 B&W and 75 native steers/heifers per collection. Multiple collections were made throughout the summer and early fall and encompass multiple feedlots. One sub-iliac lymph node was removed from each carcass and shipped to the ARS laboratory in College Station, TX for quantitative and qualitative Salmonella culture.
Findings
The Salmonella prevalence and strain diversity in fecal samples from commercial feedlot pens and assessment of associations with lymph node Salmonella at harvest was examined. A total of 1,558 fecal pat samples and 648 LN from 24 feedlot cattle pens were tested for Salmonella using an enriched broth and direct plating procedures. Based on the enrichment procedure, crude cumulative prevalence for fecal samples was 64.2% (1,000/1,558; 95% CI: 61.7 – 66.6%).
Adjusted cumulative prevalence (considering the treatment and design structure of the study) was 65.9% (95% CI: 57.8 – 73.2%). Approximately 8.2% of samples (128/1,558) had counts greater than 1 log10 CFU/g (detection limit) based on the direct plating method. Enumerable direct plating counts ranged from 2.28 to 5.08 log10 CFU/g (190 to 120,226 CFU/g). The mean and median concentration of Salmonella among enumerable samples was 3.06 log10 CFU/g and 2.94 log10 CFU/g (1,148 and 871 CFU/g), respectively. Among all samples, the mean and median concentration was 0.46 and 2.94 log10 CFU/g (3 and 871 CFU/g) with a range of -1 to 5.08 log10 CFU/g (0 to 120,226 CFU/g).
Within pen-prevalence ranged from 15 to 100% based on the enrichment procedure across all months. Within-pen prevalence ranged from 15 to 100% in June 15 to 80% in July and 24 to 96% in August. Mean concentration within pens ranged from -1.0 to 1.29 log10 CFU/g (0 to 20 CFU/g).
A subset of fecal samples (n = 424), collected pre-harvest (August), was further characterized.
Serogroups C, E and K were identified among positive fecal samples. The majority of Salmonella identified in these samples belong to serogroup C1 (275/424, 64.9%), followed by E1 (114/424, 26.9%), K (34/424, 8.0%) and Poly E (1/424, 0.2%). Montevideo (n = 273), Mbandaka (n = 1), and Tennessee (n = 1) were identified within the C1 serogroup, Anatum (n = 112) and Meleagridis (n = 2) in serogroup E1, and Cerro was the only serotype identified within the K serogroup.
81% (522/648, 95% CI= 77.3 – 83.5%) of lymph node samples tested positive for Salmonella based on the IMS-HE procedure. The adjusted cumulative prevalence for Salmonella in LN was 86.4% (95% CI = 72.0 – 94.0%). Approximately 70% of samples (452/648) had counts greater or equal than 1 log10 CFU/LN (detection limit) based on Petri-film plates.
Enumerable Petri-film plate counts ranged from 2 to 5.18 log10 CFU/LN (100 to 150,000 CFU/LN). The mean and median concentration of Salmonella among enumerable samples was 4.15 log10 CFU/LN and 4.48 log10 CFU/LN (14,125 and 30,200 CFU/LN), respectively. Among all samples, the mean and median concentration of Salmonella was 2.97 and 3.60 log10 CFU/LN (933 and 3,981 CFU/LN), respectively, with a range of -1 to 5.18 log10 CFU/LN (0 to 151,356 CFU/LN).
Within pen-prevalence ranged from 19.2 to 100% based on IMS-HE. Mean concentration within pens ranged from 3.87 to 5.09 log10 CFU/LN (7,487 to 123,760 CFU/LN).
Three serogroups (C, E and K) were identified in LN positive samples, with the majority of the Salmonella positive samples belonging to serogroup C1, followed by both C1 and E1, E1, K and E and K. Montevideo was identified within the C1 serogroup, Anatum and Meleagridis were identified within serogroup E1, and Cerro was the only serotype found within serogroup K. In samples containing mixed colonies/serogroups C1 and E1, serotypes Montevideo/Anatum, Montevideo/E1:e,h:- and Infantis/E1:e,h:- were observed (Table 1).
The performance of a PCR procedure to detect and quantify Salmonella in peripheral lymph nodes was evaluated. A total of 647 subiliac lymph nodes were tested using two real time PCR procedures. Their performance capabilities for Salmonella detection were compared to culture- based approaches. A real-time PCR for detection of the invA gene in pre-enriched samples (TSB medium) was compared to direct plating (3M Petri-film), whereas a real-time PCR for detection of the invA gene in post-enriched samples (RV medium) was compared to the IMS-HE culture method. Samples were considered positive by Petri-film if plates had counts higher or equal than 1 log10 CFU/LN and negative if they had fewer than 1 log10 CFU/LN. For real time PCR, samples with a quantification cycle value (cq) greater or equal than 38 were considered negative, whereas samples with a cq value lower than 38 were deemed positive for the invA target gene.
25% (162/647) of LN pre-enriched samples tested positive for the invA gene. The apparent sensitivity (considering Petri-film as the reference test or gold standard) of the real-time PCR in pre-enriched samples was 33.2% (150/452; 95% CI: 28.9 – 37.7%) and the apparent specificity was 93.8% (183/195; 95% CI: 89.5 – 96.8%). The Kappa statistic indicated there was slight agreement (kappa = 0.19; 95% CI: 0.14 – 0.24; P < 0.01) beyond that due to chance for the comparison between PCR and Petri-film methods. However, this Kappa statistic should be considered for reference only, as the proportion of samples considered positive by the two tests is significantly different, and thus a further evaluation of agreement is of little value (McNemar’s chi2 = 88.4, P < 0.01). After enrichment, 95.2% (616/647) of LN samples tested positive for the invA gene. The apparent sensitivity of the real time PCR in post-enriched samples, considering IMS-HE as the gold standard test, was 99.4% (519/522; 95% CI; 98.3 – 99.9%) and the apparent specificity was 22.4% (28/125; 95% CI: 15.4 – 30.7%). There was a fair agreement (Kappa = 0.31; 95% CI: 0.25 – 0.36; P < 0.01; McNemar’s chi2 = 267.8, P < 0.01) between PCR and IMS-HE methods in post-enriched samples.
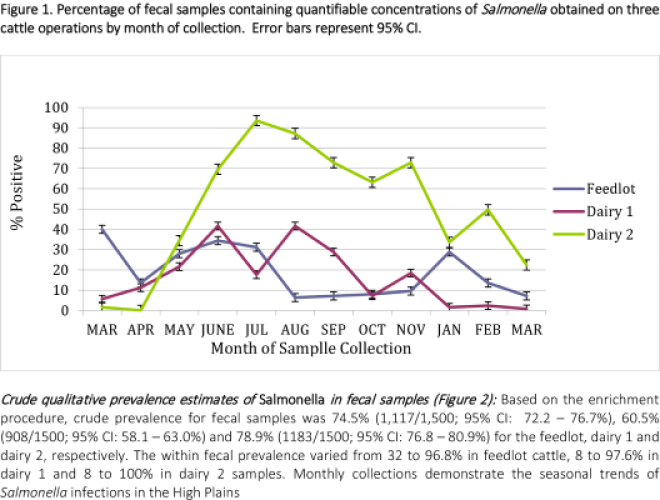
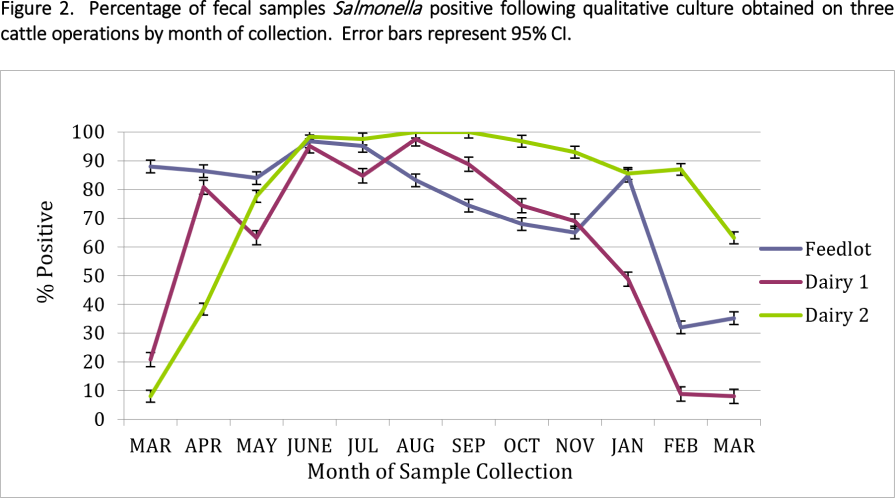
The difference in Salmonella prevalence across multiple production agriculture operations in the Texas High Plains was observed. Based on the direct plating procedure, approximately 19, 16.5 and 50.1% of samples had counts greater than 1.0 log10 CFU/g (detection limit) for feedlot, dairy one and dairy two, respectively. Enumerable direct plating counts ranged from 2.15 to 5.54 log10 CFU/g of feces (141 to 346,736 CFU/g) for the feedlot and 2.08 to 5.68 log10 CFU/g (120 to 478,630 CFU/g) for both dairy farms. Monthly prevalence ranged from .08 to 93.7% across all operations, with dairy 2 having the highest level of variation.
Using paired sampling within feedlots to determine differences in peripheral lymph node and fecal prevalence of Salmonella among Holstein (B&W) and non-Holstein (natives) cattle (ARS), the first collection of subiliac lymph nodes (140 total; 67 from natives and 73 from black and whites) was made in mid-May 2014. Holsteins and natives originated from the same feedlot however were slaughtered in different abattoirs, two days apart. None of the samples from either cattle type were Salmonella positive following quantitative culture. Two lymph nodes from B&W cattle were positive via qualitative culture. Fecal samples were not obtained. The second collection was made in early June, and cattle that were sampled originated in a different feedlot from the first collection and were all slaughtered in the same facility on the same day. Results were surprisingly different from the first collection. Nearly all of the cattle (97.3 and 100% of natives and B&W, respectively) had significant concentrations of Salmonella in their sub-iliac lymph nodes. Average concentration ranged from 0.4 – 3.8 CFU (log10)/g of LN across cattle type and averaged 3.1 and 3.4 CFU (log10)/g of LN for natives and B&W, respectively. Lymph nodes were 100% Salmonella positive following qualitative culture. An attempt was made to collect fecal samples in the feedlot one day prior to slaughter, however, heavy rains had made the pens extremely muddy and collection of uncontaminated manure pats impossible.
The Salmonella prevalence and strain diversity in flies from commercial feedlot pens and their associations with lymph node Salmonella at harvest in conjunction with vaccine experiment was assessed. Unfortunately, the feedlot managers were not receptive to the placement of fly traps or collection via nets, so no flies were examined in conjunction with the study presented under Objective A above.
Implications
Salmonella was detected in a high proportion (65.9%) of fecal samples in this population of commercial feedlot cattle. Likewise, the proportion of Salmonella recovered from sub-iliac lymph nodes was high (86.4%), which is consistent with the prevalence of Salmonella observed in feedlots located in a similar geographical region (west Texas). The within-pen fecal prevalence varied from 15 to 100%, whereas lymph node prevalence ranged from 19.2 to 100% within pens. Surprisingly, the within pen prevalence of Salmonella in fecal samples was negatively associated with the within pen prevalence of Salmonella in lymph nodes at harvest. However, the means for lymph node prevalence were high (>75%) in the pens with both relatively high and relatively low fecal prevalence during the sampling periods. As previously reported for cattle in this region and coinciding with the serotypes most commonly isolated from ground beef in federal testing programs, Montevideo and Anatum were the predominant serotypes identified among fecal and lymph node samples in this study. When the performance of a real time PCR test for detection of the Salmonella in lymph nodes was assessed in comparison with a direct plating procedure in pre-enriched samples, PCR showed a relative sensitivity (Se) and specificity (Sp) of 33.2% and 93.8%, respectively. In post-enriched samples, the Se and Sp of the PCR test were 99.4% and 22.4%, respectively, relative to the IMS-HE procedure. Further testing and validation are being conducted to assess the ability of PCR to quantify Salmonella bacteria in lymph nodes and feces.
The high fecal Salmonella prevalence observed is consistent with previous research evaluating Salmonella in this region of the United States. The difference in prevalence across operations is intriguing because all operations are located within the same geographical region (1.5 km); this would suggest that the varying levels of Salmonella may be attributed to general management practices (GMPs) within operations. The GMPs that vary across these operations consist of pest control, hygiene practices, vaccination protocols, and feed additives. Throughout the sampling period, feedlot animals were fed both DFMs and ionophores, whereas both dairies fed ionophores, but only dairy 2 administered a Salmonella vaccine. Future research will seek to explain the differences among operations as well as examine potential vectors for Salmonella transmission such as flies and other biting insects.
Due to unexpected delays, this research is still in the very early stages and attempting to draw any conclusions would be premature. The goal of the research comparing PLN Salmonella prevalence in B&W and colored cattle, is to increase the overall understanding of Salmonella uptake and elimination dynamics in all cattle types. Previous research has documented differences among cull (dairy and beef) and feedlot cattle, with fed cattle having a higher incidence of Salmonella in the PLN. This was somewhat surprising considering fecal Salmonella shedding is often observed in cull dairy cattle. Comparison of steers within the same feedlot should provide insight into whether the differences observed in cull cattle are a result of breed, age, or perhaps previous Salmonella exposure.
Seasonal fluctuations in prevalence of Salmonella in the PLN, coupled with the ease at which Salmonella can be introduced to the PLN via our transdermal inoculation model, suggests flies and other biting insects may play a role in transmission of Salmonella to these nodes.
Monitoring of flies (species and Salmonella status) may aid in the understanding of the seasonality of Salmonella in the PLN and aid in the placement of interventions to disrupt the cycle when Salmonella is most prevalent.
Table 1. Distribution of Salmonella serogroups and serotypes in lymph node and fecal samples (August sampling).
|
Serogroup |
Serotype |
Feces n (%) |
Lymph nodes n (%) |
|
|
|
|
|
|
C1 |
Montevideo |
273 (64.4) |
443 (84.5) |
|
|
Mbandaka |
1 (0.2) |
0 (0.0) |
|
|
Tennessee |
1 (0.2) |
0 (0.0) |
|
|
|
|
|
|
E1 |
Anatum |
112 (26.4) |
28 (5.3) |
|
|
Meleagridis |
2 (0.5) |
1 (0.2) |
|
|
|
|
|
|
K |
Cerro |
34 (8.0) |
12 (2.3) |
|
|
|
|
|
|
Mixed colonies/serogroups |
|||
|
|
|
|
|
|
C1/E1 |
Montevideo/Anatum |
0 (0.0) |
36 (6.9) |
|
|
Montevideo/E1:e,h:- |
0 (0.0) |
2 (0.4) |
|
|
Infantis/E1:e,h:- |
0 (0.0) |
1 (0.2) |
|
|
|
|
|
|
E/K |
Mixed |
0 (0.0) |
1 (0.2) |
|
|
|
|
|
|
Poly E |
Mixed |
1 (0.2) |
0 (0.0) |
|
|
|
|
|
|
Total |
|
424 (100.0) |
524 (100.0) |
Association between Salmonella lymph node and fecal prevalence: The presence of more than 15 (median value) Salmonella positive fecal samples in a pen in June. More than 9 positive fecal samples in July and more than 19 positive fecal samples per pen in August were significantly associated (P < 0.05), in the univariable screen, with the pen-level prevalence of Salmonella in lymph node samples (Table 2). When all three variables were assessed in a multivariable model, fecal prevalence in June was the only variable that remained significantly associated with the outcome at the 5% level. However, because the associations between Salmonella lymph node prevalence and fecal prevalence for one month may be confounded with fecal prevalence in other month(s), the July and August fecal prevalence variables were explored as potential confounders. Both variables acted as confounders, analytically, as their presence changed the model coefficients more than 20%, hence, all the variables were kept in the final multivariable model. Further exploration of these and other associations is warranted, particularly because results demonstrate an inverse relationship between fecal and lymph node prevalence.
Table 2. Model-adjusted means, standard errors of the mean (SEM) and 95% confidence intervals of univariable associations between monthly fecal prevalence and lymph node (LN) prevalence.
|
Median # of positive fecal samples in a pen by sampling month |
Mean LN prevalence (%) |
SEM (%) |
Mean 95% CI (%) |
P-value*
|
|
|
|
|
|
|
|
June prevalence |
|
|
|
< 0.01 |
|
< 15 positive fecal samples |
91.28 |
3.78 |
78.88 – 96.70 |
|
|
> 15 positive fecal samples |
79.88 |
7.54 |
58.83 – 91.69 |
|
|
|
|
|
|
|
|
July prevalence |
|
|
|
< 0.01 |
|
< 9 positive fecal samples |
93.49 |
3.24 |
82.20 – 97.81 |
|
|
> 9 positive fecal samples |
75.24 |
9.41 |
50.55 – 90.04 |
|
|
|
|
|
|
|
|
August prevalence |
|
|
|
0.03 |
|
< 19 positive fecal samples |
90.20 |
3.97 |
77.88 – 96.01 |
|
|
> 19 positive fecal samples |
82.28 |
6.37 |
64.33 – 92.28 |
|
*P-values reflect the statistical significance of the univariable associations between each specific predictor and the outcome (i.e., results from 3 separate models) after accounting for the study design structure.


