Today’s Beef Consumer: Summer 2024 Update
August 2024
at a glance
introduction
While seeing areas of economic improvement, consumers remain wary of the future. The National Cattlemen’s Beef Association (NCBA), a contractor to the Beef Checkoff, continuously tracks trends, monitors issues, and stays abreast of the trends that have potential to impact the beef industry to better understand Today’s Beef Consumer.
the consumer landscape
Despite some positive economic indicators, consumers remain cautious about future conditions. The University of Michigan’s Consumer Sentiment Index increased modestly in August 2024 to 67.8, the second lowest level of 2024, reflecting ongoing concerns about high prices and economic uncertainty.1 Key worries include inflation trends, the prime lending rate, global instability, and pressures about food away from home, shelter, energy, and insurance. While inflation cools from the 2022 highs, prices remain higher than pre-pandemic levels and continue to strain household budgets. Food away from home prices also remains elevated, up over 4% year-over-year.3 As a result, consumers often look for cost-saving measures in their food purchases and dine out less frequently.
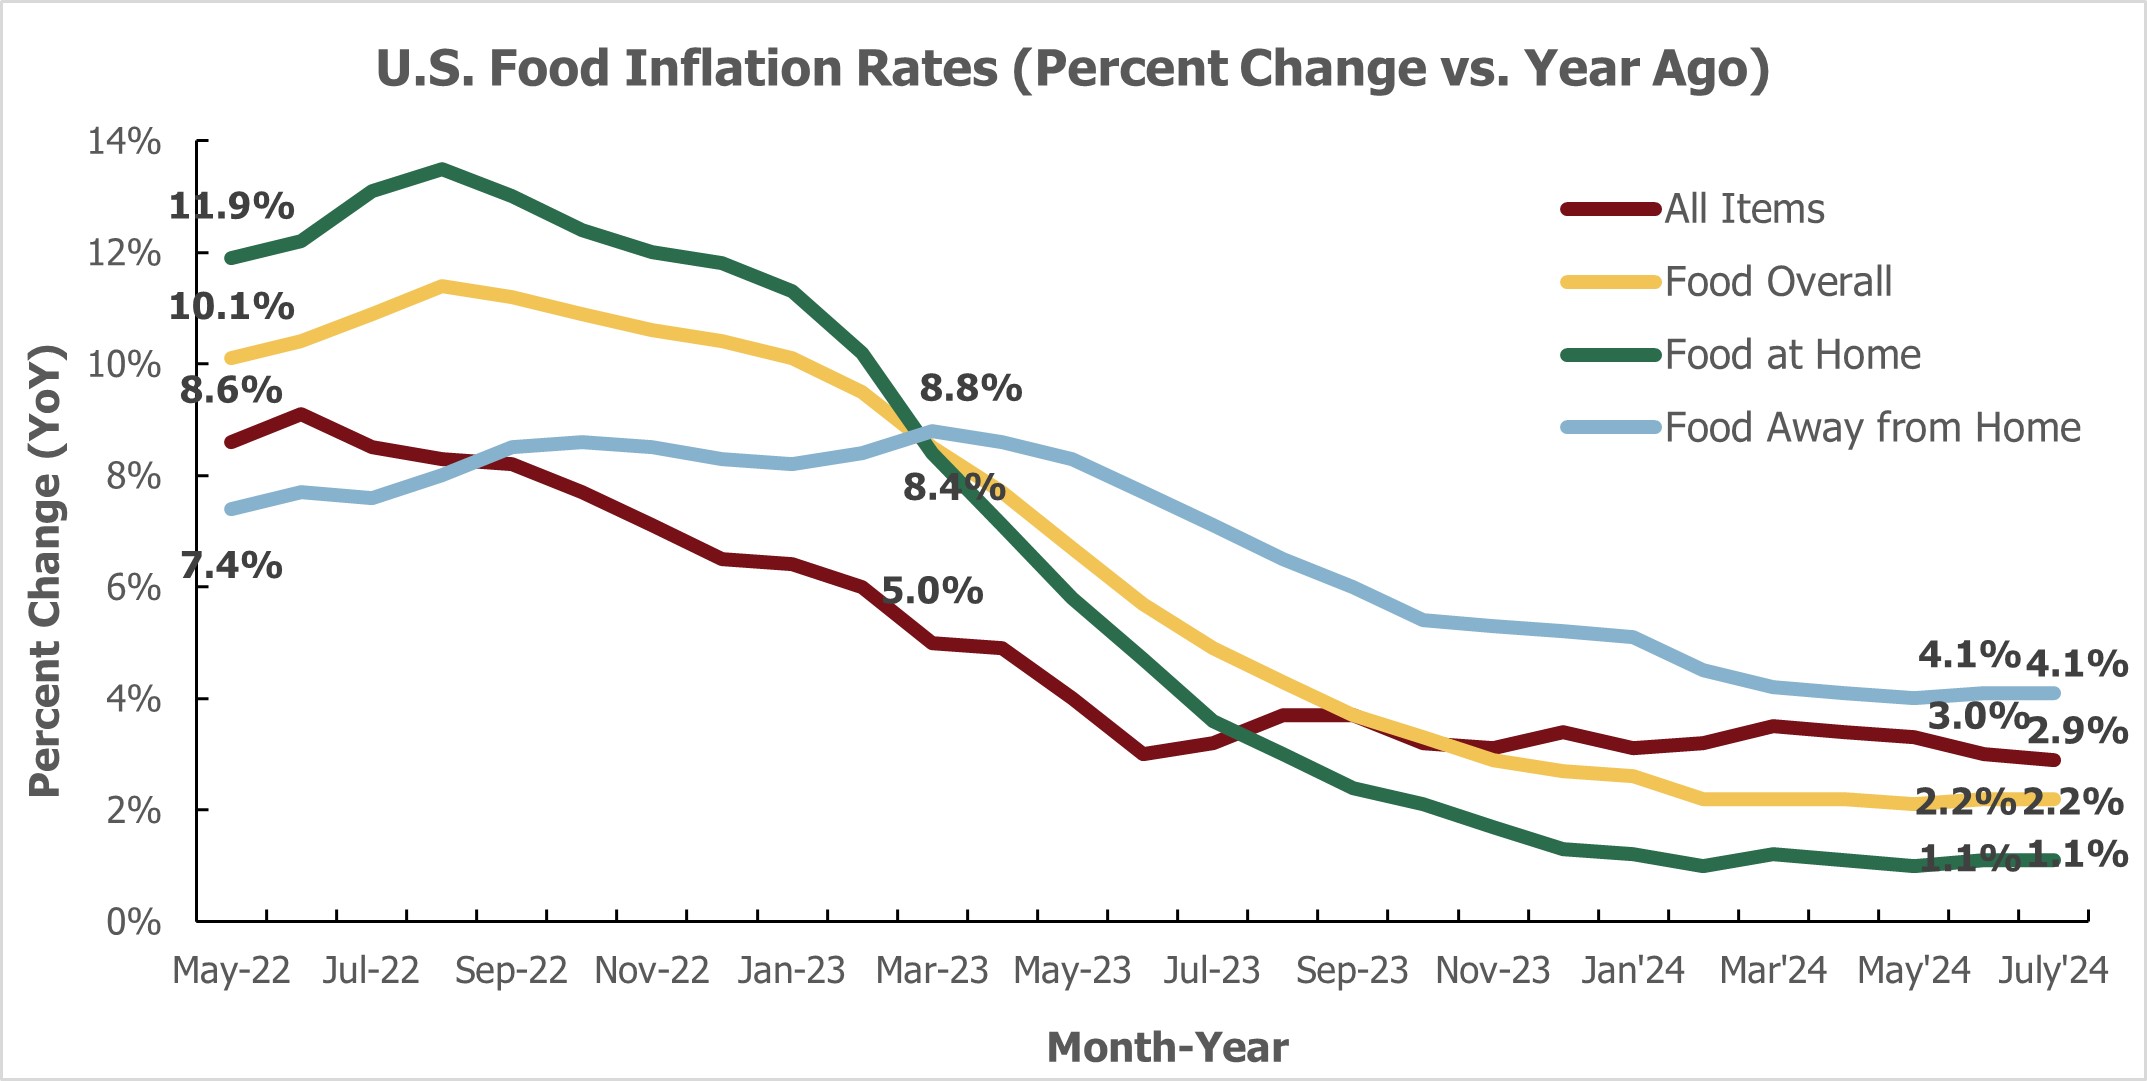
Figure 1
U.S. Food Inflation Rates, 2022-2024.
SOURCE: U.S. Bureau of Labor Statistics, Consumer Price Index, Not Seasonally Adjusted, July 2024 release.
While year-over-year food away from home costs have exceeded overall food inflationary levels since February of 2023; food at home levels have maintained the 1% range in 2024, a significant turn-around from over 13% mid-summer of 2022.3 Over the past 12 months, the CPI for meats, poultry, fish, and eggs has increased 3.0%, driven by factors such as strong consumer demand, increased production costs, disease outbreaks, and supply chain issues.3 For instance, beef and veal prices have increased by 4.5%, while chicken and pork prices have gone up by 1.7% and 3.6%, respectively.3 Egg prices have also surged, with a 19.1% year-over-year gain.3 In contrast, dairy and related products have decreased by 0.2%, and fish and seafood have dropped 1.6%.3 When looking at the overall inflationary landscape, it is encouraging to see CPI hover in the 3% range for all of 2024. In July of 2024, the CPI dropped below 3% for the first time since March of 2021.3
When looking at the overall inflationary landscape, it is encouraging to see CPI hover in the 3% range for all of 2024. In July of 2024, the CPI dropped below 3% for the first time since March of 2021.3
consumption and sales trends
Year-to-date beef prices through August 10, 2024, averaged $6.58/lb., up 6.3% versus a year ago. Over the same time period, chicken prices rose 0.8% and pork prices increased 4.6%.4
Nonetheless, consumption and demand remain robust, as indicated by consumer-reported consumption and retail sales data. A large majority of consumers eat beef and chicken at least once per week.5 While consumers continuously perceive beef to be second to chicken in terms of value for the money, beef leads in taste and versatility, driving its demand and affecting consumption and preference.5 Consumers plan to purchase more chicken and ground beef, but less beef steak, pork sausage and deli meats.2
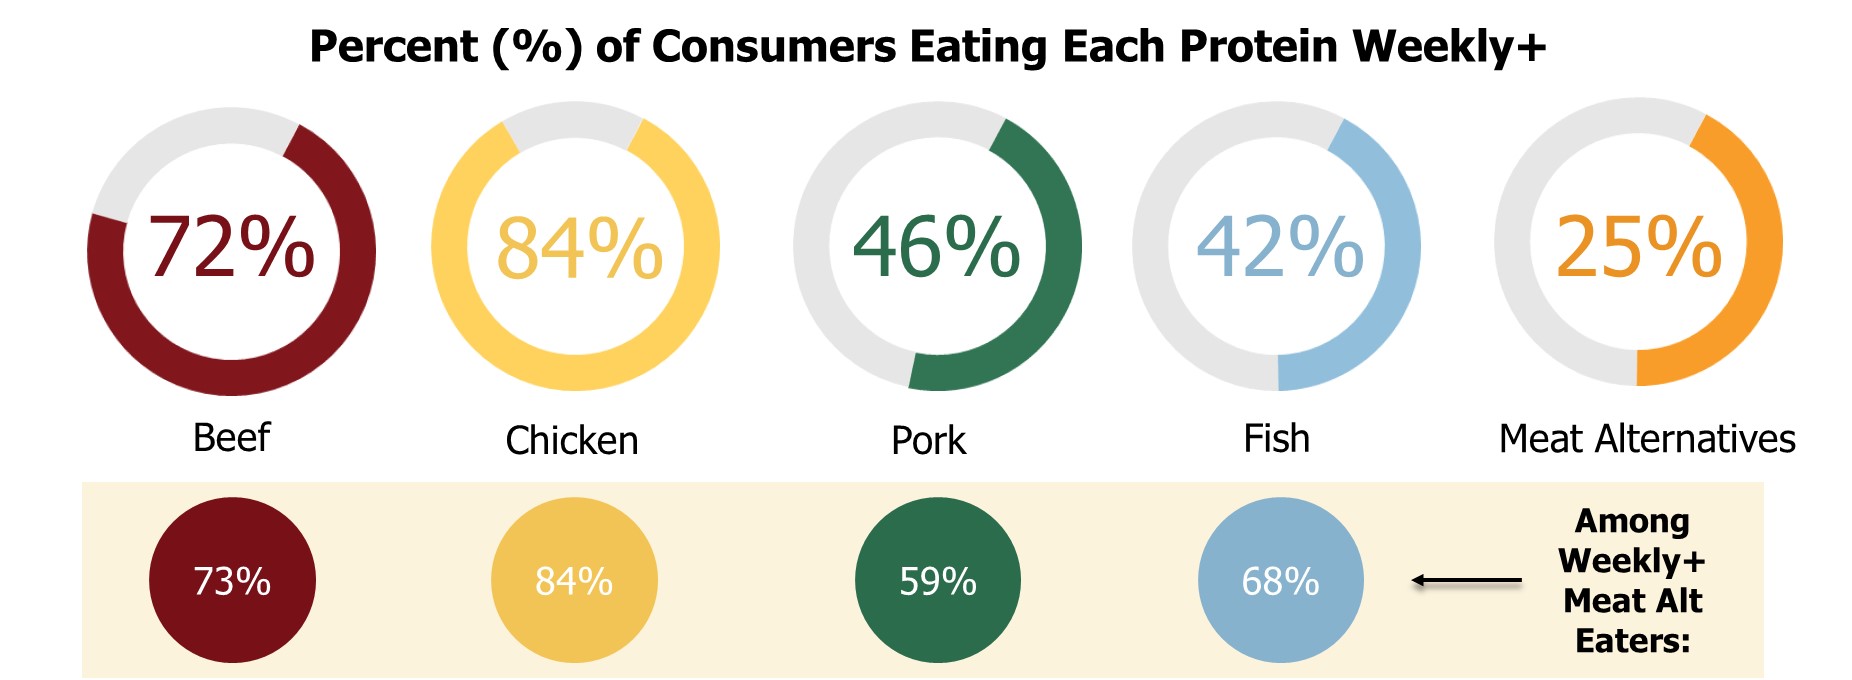
Figure 2
Consumers of Meat Alternatives Still Eat Other Proteins
SOURCE: Consumer Beef Tracker, analyzed and summarized by NCBA, on behalf of the Beef Checkoff, January-June 2024.
The total value of fresh meat sales year-to-date rose 5%, driven by a 4% price increase, while the total pounds sold saw a modest gain of 0.9%. Beef led the growth in the fresh meat value with a 6.9% increase, supported by higher retail prices. Within the beef category, ground beef value rose by 8.7%, and steak value increased by 6.3%. While the overall value of beef is showing gains in 2024, the total pounds of fresh beef sold held a modest increase of 0.6%, with ground beef up by 2.5%, offsetting declines in other cuts like roasts and briskets.4
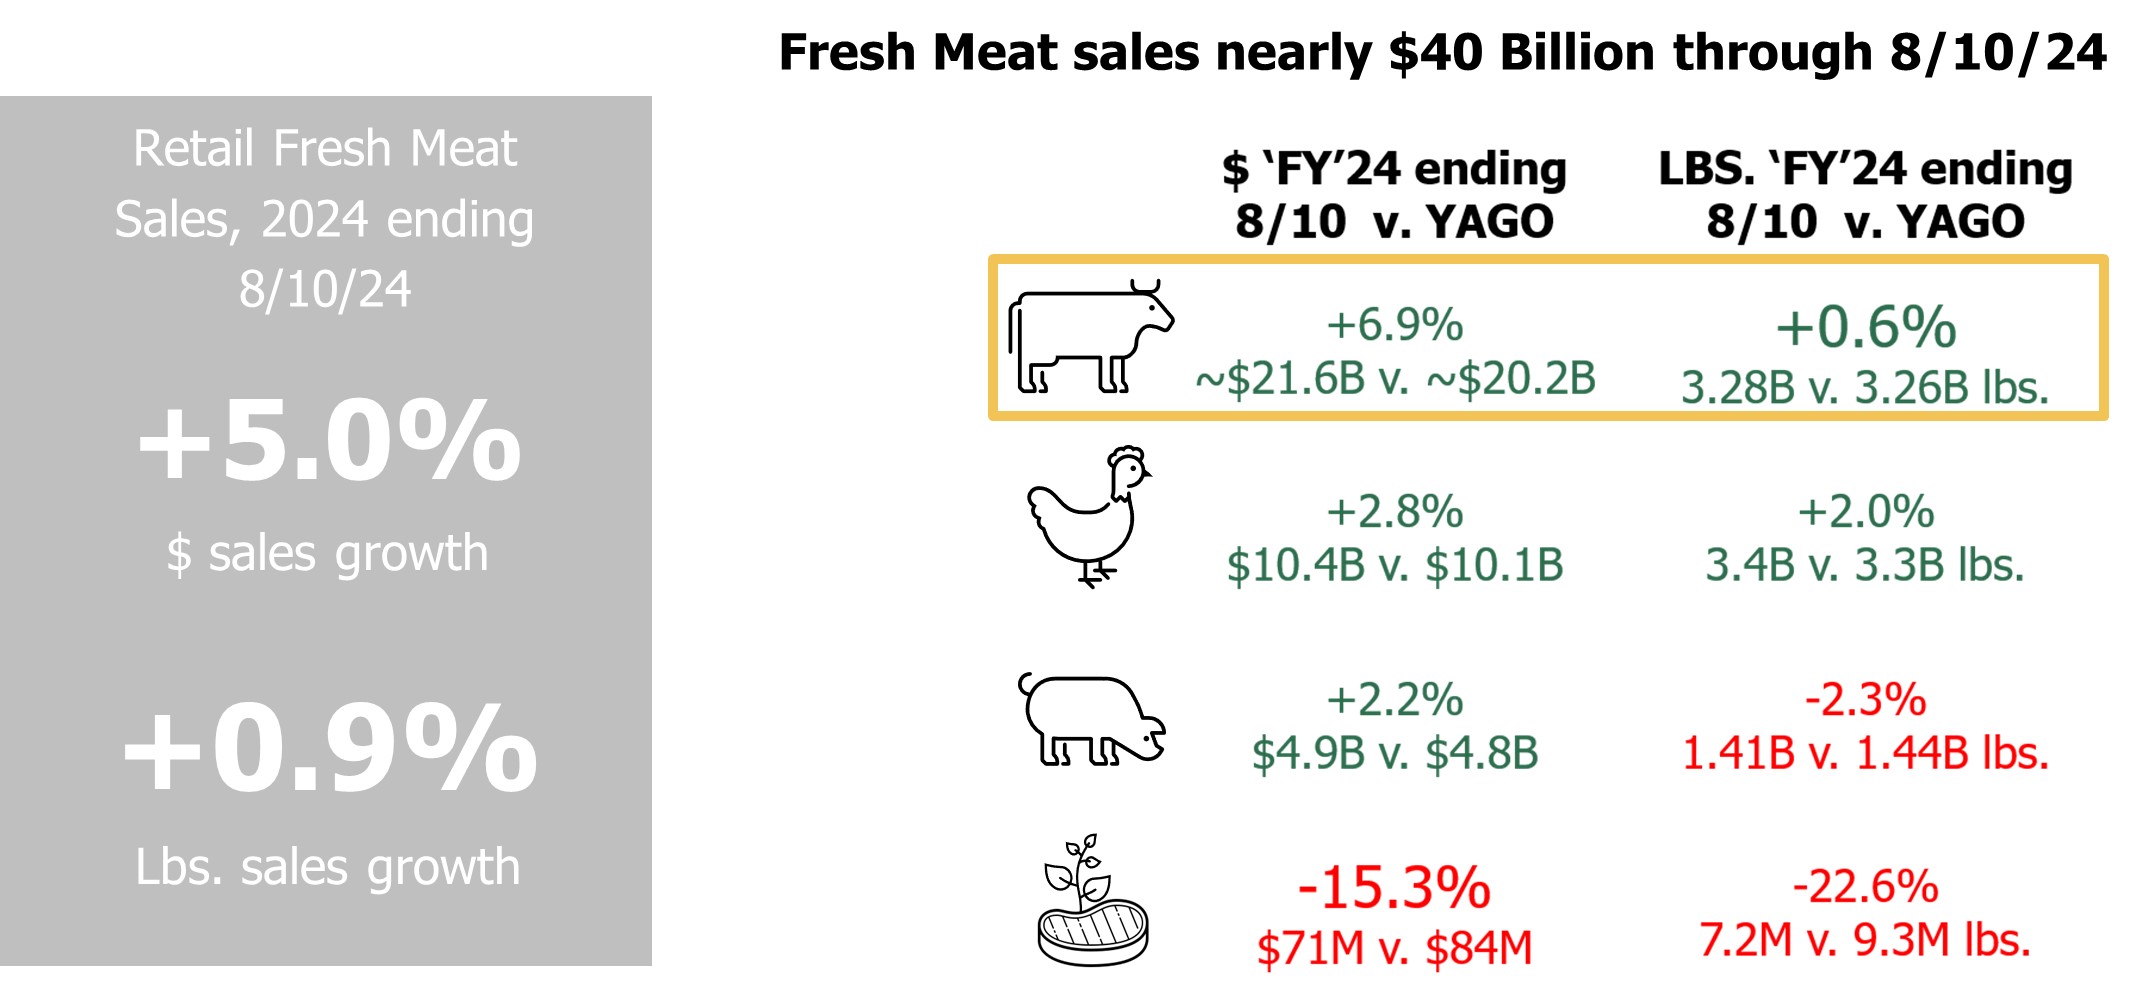
Figure 3
January – August 10, 2024, Fresh Beef Sales at Retail
SOURCE: NielsenIQ Discover, 1/1/23 – 8/12/23 – 1/1/24 – 8/10/24 Fresh Beef Sales by Volume and Value, Data ending 8/10/2024.
Other proteins are experiencing mixed gains across various cuts. Dollars and pounds sold for chicken are both up, while pork is up in dollars sold but down in pounds.4 Meat alternatives continue to struggle, with declines in both total value and pounds sold, despite an increase in price per pound.4 This trend suggests that consumers still favor traditional meat products over alternatives. When reviewing our latest consumer beef tracker data, meat alternative consumers also consume beef and other animal proteins as much, if not more, than the average consumer, as indicated in Figure 2.5 It appears that they are adding these alternatives for variety rather than substituting other proteins.
streching dollars: cost-saving strategies
According to Statista, 52% of U.S. consumers identify “rising prices/inflation/cost of living” as their biggest challenge.8 This economic pressure continues influencing shopping habits and decision-making, with consumers prioritizing essential items and spending more cautiously.
Recent survey data covering the first six months of 2024 indicates consumers are looking for ways to save money. About 35% of consumers reportedly have more meals at home and plan to continue this trend.2 In fact, around three-quarters of meals are being prepared at home.2 Conversely, consumers are dining out less frequently due to the high cost and cutting back on discretionary spending.2 By doing so, consumers can better allocate their budgets toward essential items like groceries, especially as many consumers have reported increased grocery spending in the last six months, likely driven by higher store prices.2
Consumers are also adopting various cost-saving strategies to stretch their dollars further. About one-third of consumers actively seek out deals or coupons, and some opt for store or private labels that offer quality products at lower prices.2 According to Kantar, about 46% of shoppers plan to buy more private labels over the next year, compared to 27% saying the same for national brands.7 Additionally, consumers are becoming more strategic with their meals and food planning. More than one-quarter of consumers are reusing leftovers or stocking up and freezing items to maximize their food supply and savings.2 As economic uncertainties persist, consumers will continue prioritizing these habits, ensuring they get the most value for their money.
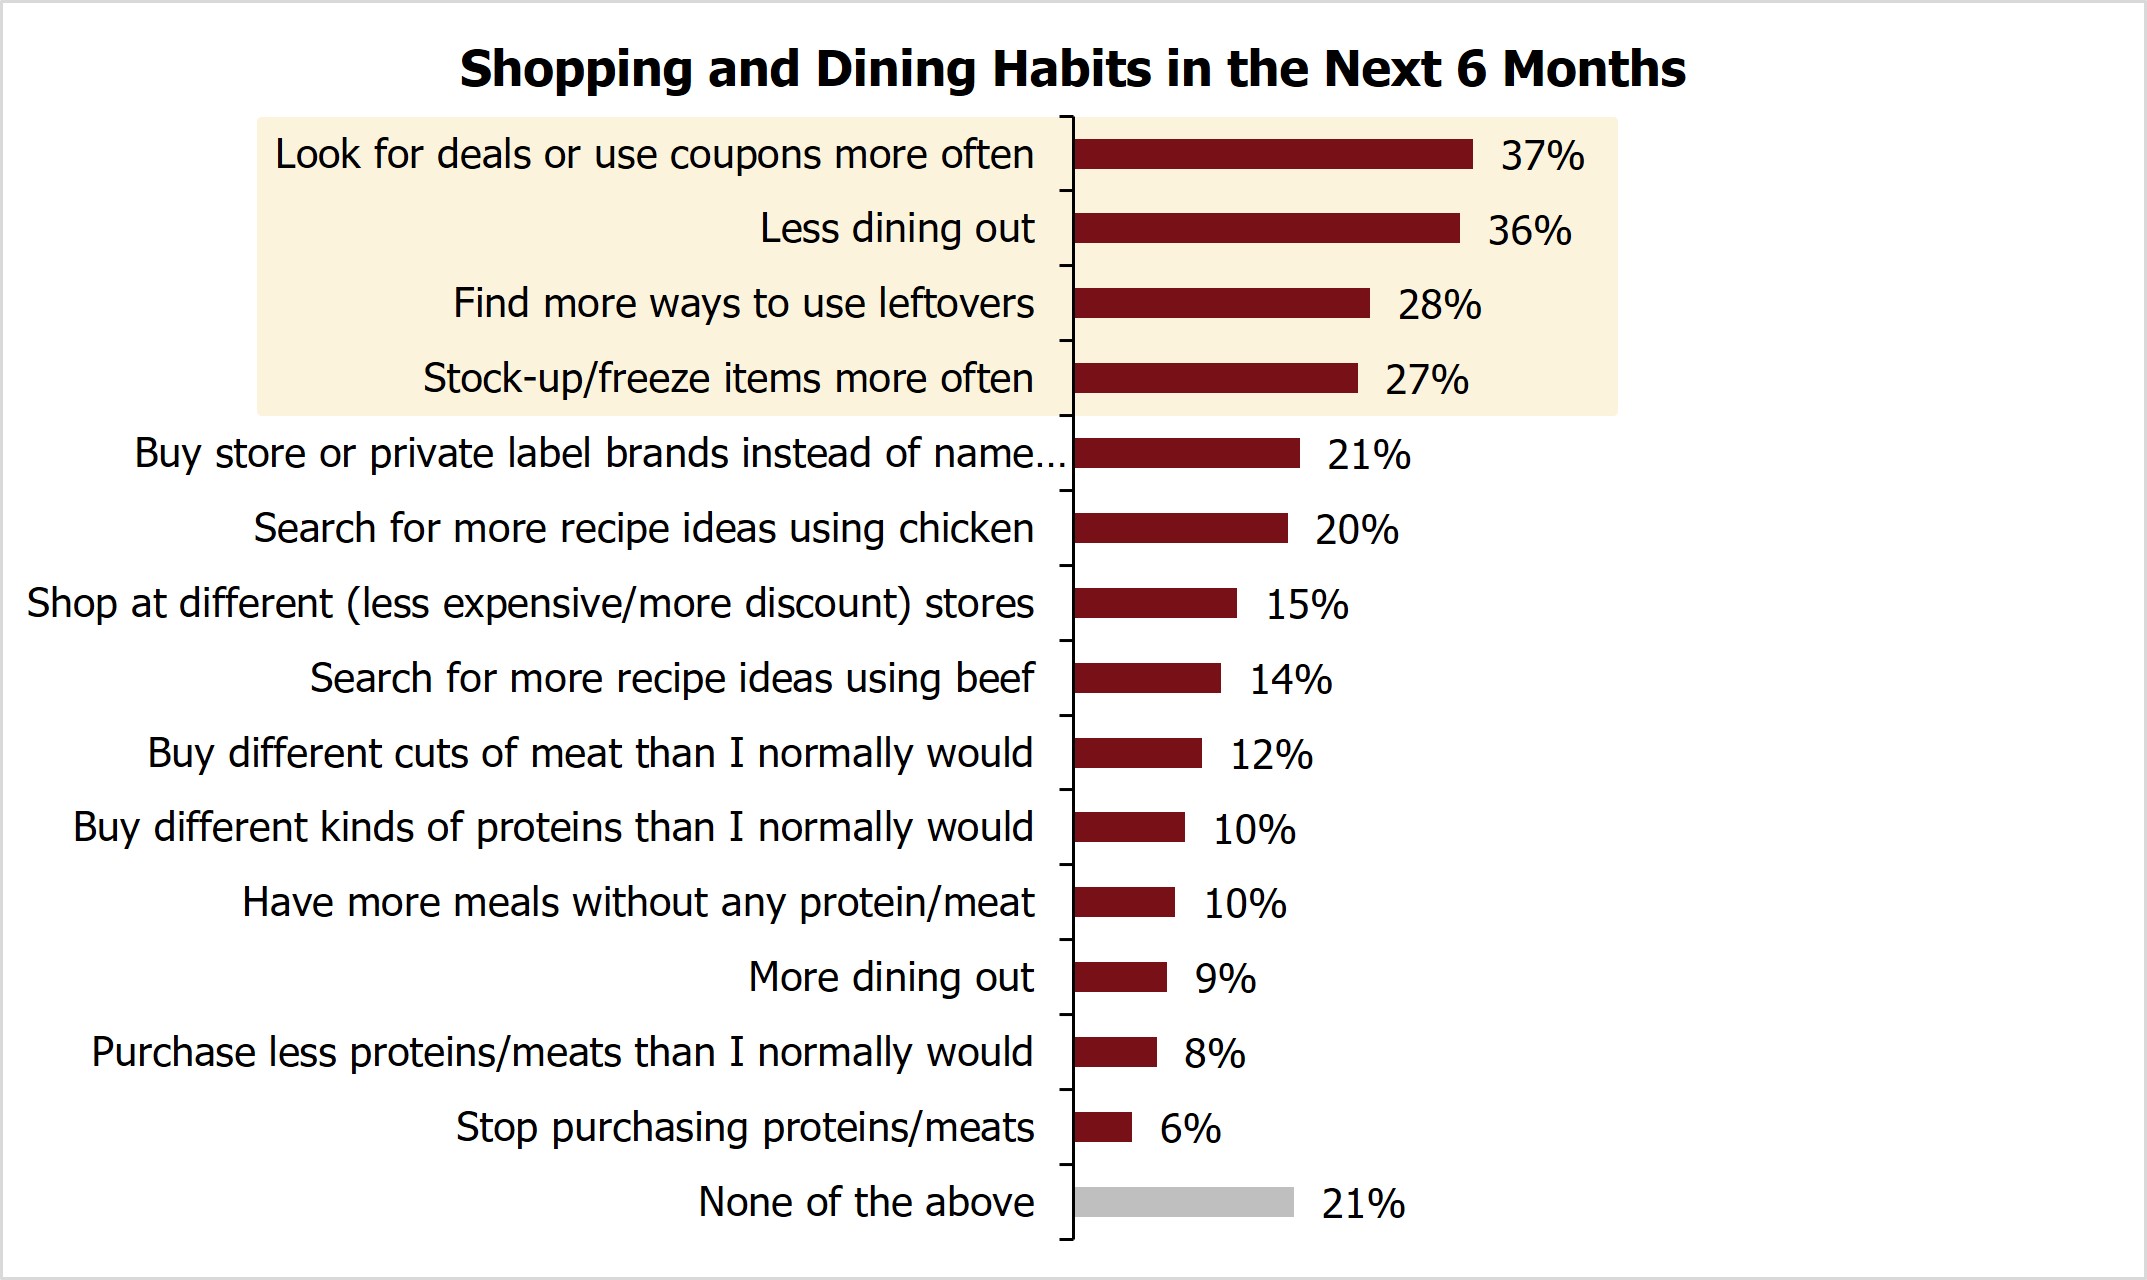
Figure 4
Shopping and Dining Habits in the Next 6 Months
SOURCE: State of Consumer, January-June 2024. “Thinking about your current shopping and dining habits, in which ways, if any, do you see them changing in the next 6 months? Select all that apply.”
food e-commerce
While brick-and-mortar stores will continue playing a dominant role in grocery shopping, accounting for nearly 80% of food purchases, steady growth in online food purchases is expected.6 The initial surge of online ordering has leveled off, but convenience, time-saving benefits, and ease of use keep attracting consumers.2 The pandemic may have kickstarted this trend, but it’s here to stay.
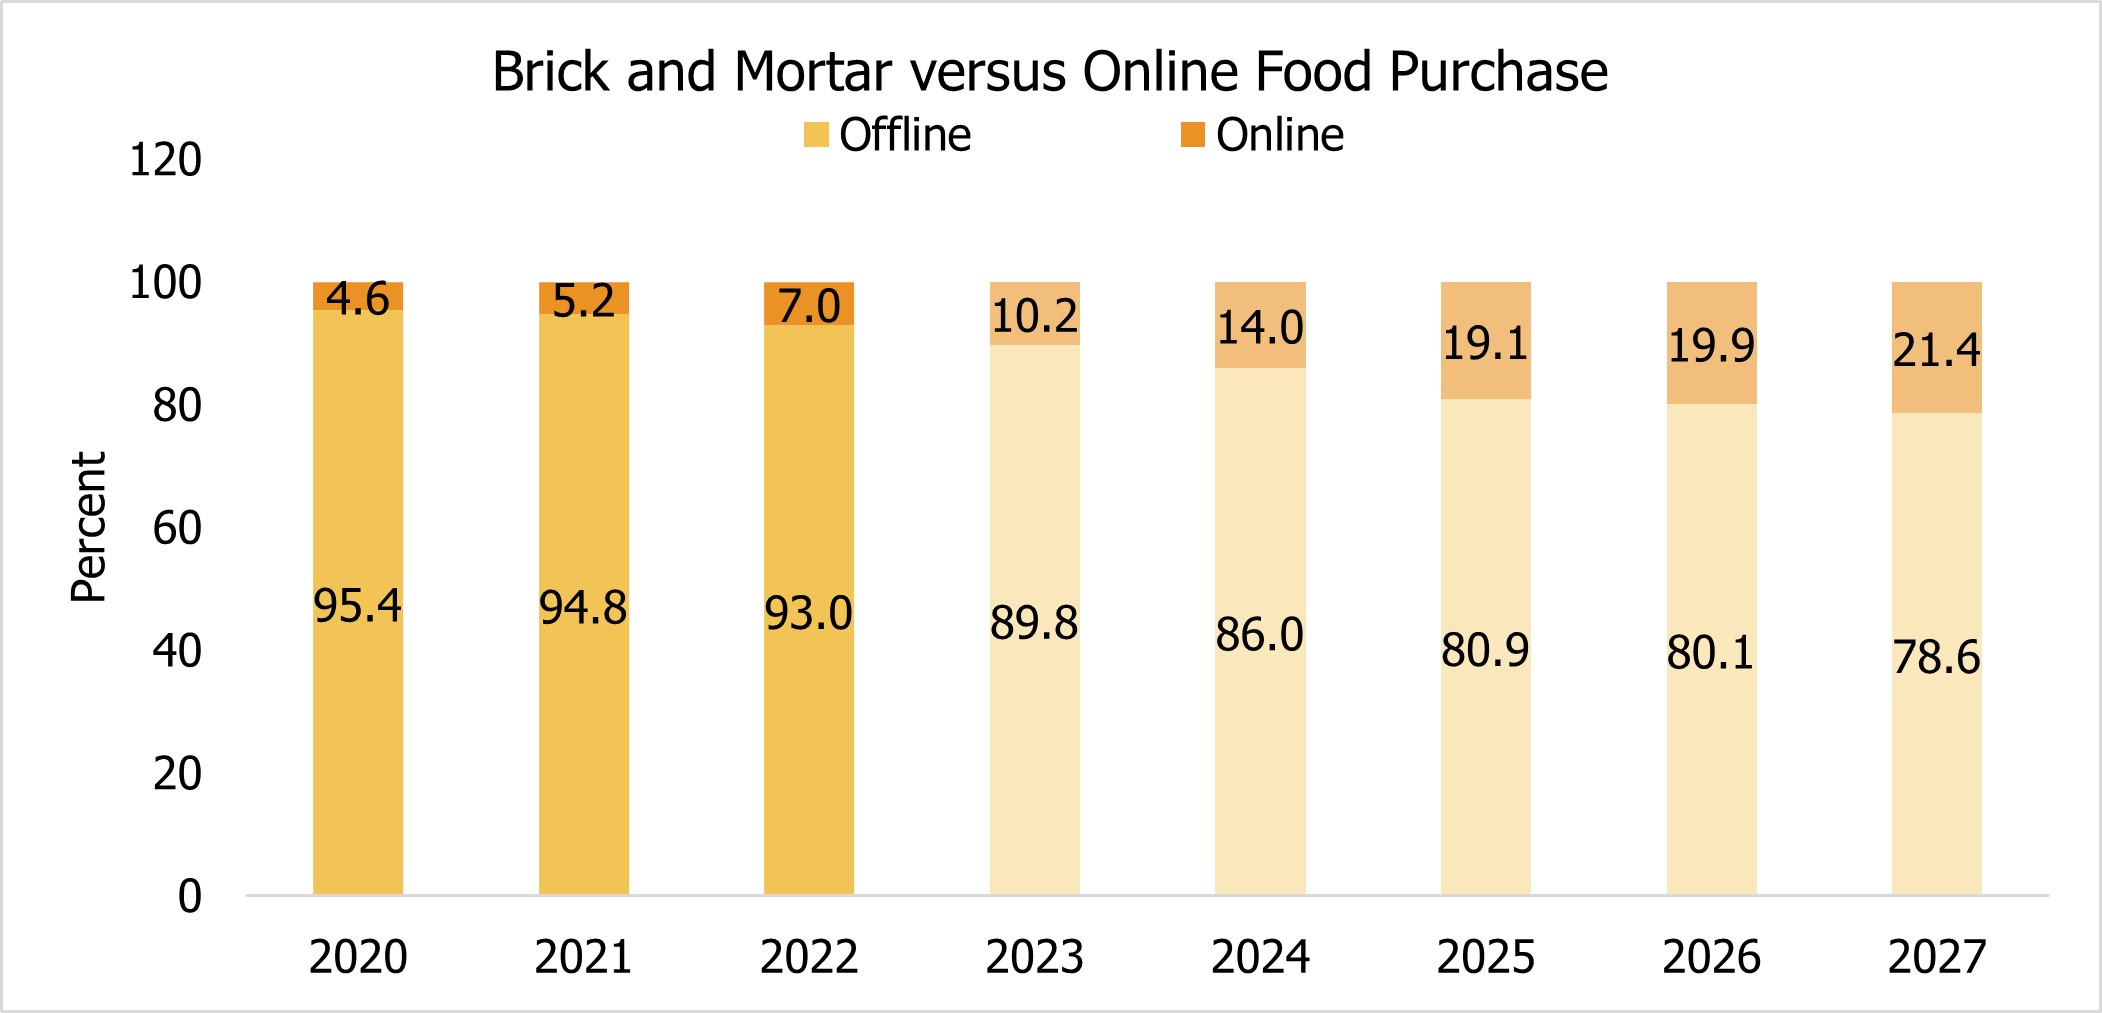
Figure 5
Brick and Mortar versus Online Food Purchase; Looking forward to 2027, Brick & Mortar Projected as the Dominant Outlet for Food Purchases although steady growth in e-commerce expected.
SOURCE: Statista Market Insights, 7/1/23.
The State of Consumer survey found that most consumers use these platforms and services monthly, with approximately three-quarters actively ordering meals and over half ordering groceries.2 This reflects a stable trend in recent years. A study by Appinio suggests that the majority of each age group typically grocery shop in stores, with older shoppers tending to shop in-store more often than their younger counterparts.9 Furthermore, the Shopper Scape Grocery Deep Dive highlights that millennials, parents, and urban consumers are more likely to embrace online grocery shopping. Online shopping carts typically contain non-perishable packaged goods and dairy products.2 Approximately 25% to 45% of online shoppers include fresh proteins in their purchases.2 Notably, 36% of online shoppers included fresh beef in their carts recently, and most were satisfied with their purchase.
conclusion
While there are signs of relief, such as moderating inflation rates and a slight uptick in consumer confidence, overall inflationary pressures persist. In response, consumers continue finding ways to stretch their budgets, whether by enjoying more meals at home, searching for deals, or opting for lower-cost alternatives. Additionally, the food e-commerce sector expects steady growth in the coming years, reflecting consumer’s preferences for convenient shopping solutions.
Sources:
- University of Michigan, Consumer Sentiment Index, August 2024.
- State of Consumer, analyzed and summarized by NCBA, on behalf of the Beef Checkoff, January-June 2024. 3
- U.S. Bureau of Labor Statistics, Consumer Price Index, Not Seasonally Adjusted, July 2024 Release.
- NielsenIQ, Discover, Year to Date Retail Protein Sales, week ending 8/10/24.
- Consumer Beef Tracker, analyzed and summarized by NCBA, on behalf of the Beef Checkoff, January-June 2024.
- Statista Market Insights, 7/1/23.
- Kantar, FMI, “The Power of Private Brands 2024” report.
- Consumers in the U.S., Statista Consumer Insights, June 2024.
- Appinio, “Where Consumers Usually Purchase Groceries in the United States in June 2023, by Age Group.” Statista, Statista Inc., August 2023.
- ShopperScape Grocery Deep Dive, February 2021, 2022, 2023, and 2024.